NYC's 2026 maturity wall, lender by lender: the bank with the most loans coming due is the one pulling back from New York
A data brief on the lenders behind New York City's 2026 maturity wall: 139 commercial mortgages of $5 million or more, $8.70B, whose maturity date is written into the recorded instrument and falls in the next twelve months, ranked by the institution that originated them and bucketed by lender type. One loan, the GM Building's, is a quarter of the dollars; by count the leader is Flagstar Bank, the former New York Community Bank — while it shrinks its New York book, the Fed raises rates and the city freezes stabilized rents.
By Circlemark · · 13 min read · Figures as of Oct 2, 2026
139 commercial mortgages of $5 million or more in New York City, $8.70B in all, carry a maturity date written into the recorded instrument that falls in the next twelve months. One loan, the GM Building's $2.30B, is 26% of the dollars. By count the leader is Flagstar Bank, the former New York Community Bank, with 25 — at the moment it is shrinking its New York book, the Fed has started raising rates again, and the city has frozen stabilized rents.
This brief ranks the lenders behind the wall, from the record. Last month's brief counted New York's maturity wall borough by borough. This one asks the question a broker asks next: who wrote these loans, and will they write the next one?
The answer below covers active commercial mortgages of $5 million or more in the four ACRIS boroughs whose maturity is stated — read off the scanned instrument or taken from securitization disclosure (ABS‑EE). One loan counts once, however many parcels secure it. Every lender is the institution that originated the loan, as recorded, with its spellings and lending vehicles folded together. Counts are as of October 2, 2026; the window runs Oct 2, 2026 to Oct 1, 2027.
One loan in 19 has its maturity on paper
Start with the number most maturity-wall figures leave out. Of the 2664 active NYC commercial loans of $5 million or more that our own model places in the next twelve months, 139 have a maturity date we could read off a recorded document. The rest is inferred: an origination date and a typical term for that lender type and loan size. That inferred figure is $76.84B; the part on paper is $8.70B.
Most published maturity-wall figures blend the two without saying so. This one keeps them apart, and every table below is built only from the part on paper. ACRIS records no maturity field, so the date exists only where a lender wrote it on the face of the instrument — about half of plain mortgages do, and almost no consolidation agreements — or where a securitization disclosed it. Of the 139 dates here, 69 were read off the recorded instrument and 70 come from securitization disclosure (ABS‑EE and Freddie Mac) — but the disclosed ones are the big ones, $7.32B of the $8.70B. The stated wall is therefore a floor: a lender absent from these tables may well have loans coming due; it has not told the county when.
Who wrote the loans coming due
| # | Originating lender | Type | Loans | Volume | Median loan |
|---|---|---|---|---|---|
| 1 | Morgan Stanley Bank | Bank | 3 | $2,947.2M | $598.2M |
| 2 | Natixis Real Estate Capital | CMBS conduit | 2 | $588.6M | $294.3M |
| 3 | Barclays Bank | Bank | 4 | $504.8M | $125.0M |
| 4 | Wells Fargo Bank | Bank | 4 | $445.7M | $22.3M |
| 5 | Bank of Montreal | Bank | 1 | $365.0M | $365.0M |
| 6 | Goldman Sachs Mortgage Company | CMBS conduit | 3 | $313.5M | $104.5M |
| 7 | Citigroup Global Markets Realty | CMBS conduit | 5 | $275.9M | $21.8M |
| 8 | Flagstar Bank (formerly New York Community Bank) | Bank | 25 | $252.9M | $7.6M |
| 9 | Deutsche Bank AG New York Branch | Bank | 5 | $250.8M | $40.0M |
| 10 | State Farm Realty Mortgage | Life company | 4 | $203.0M | $60.0M |
| 11 | Citi Real Estate Funding | CMBS conduit | 7 | $187.9M | $22.0M |
| 12 | Goldman Sachs Bank USA | Bank | 1 | $175.0M | $175.0M |
| 13 | Argentic Real Estate Finance | Debt fund | 3 | $166.8M | $16.0M |
| 14 | Starwood Mortgage Capital | CMBS conduit | 2 | $111.9M | $56.0M |
| 15 | Morgan Stanley Private Bank | Bank | 1 | $109.0M | $109.0M |
Active NYC commercial mortgages of $5M or more with a stated maturity between Oct 2, 2026 and Oct 1, 2027, one row per loan, grouped by originating institution. Median loan is the median original principal.
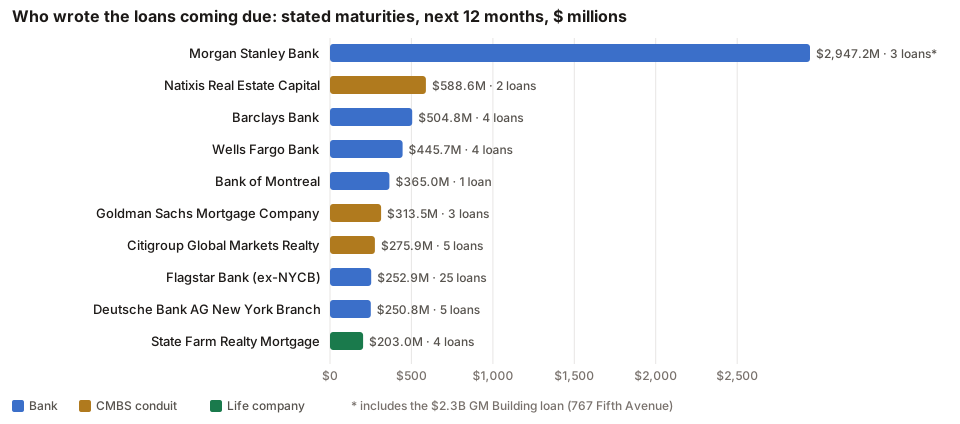
Two rankings hide in one table. By dollars, the wall is a handful of Manhattan office loans from 2017. Morgan Stanley Bank's $2.3 billion mortgage on the GM Building at 767 Fifth Avenue — interest-only at 3.43%, due June 9, 2027 — is 26% of everything coming due on its own, and its $598 million on 237 Park Avenue is next; Natixis holds $359 million on 85 Broad Street and $230 million on 75 Broad; Wells Fargo $396 million on 85 Tenth Avenue; Barclays $235 million on 225 Park Avenue South. 67 of the 139 loans were recorded in 2017, $6.34B of the $8.70B: ten-year conduit paper written at the top of the last cycle, which is why June 2027 alone carries $3.37B and August 2027 another $1.55B. Office is 58% of the dollars; Manhattan 90%.
By count, the wall is a bank wall, and one bank's. Flagstar wrote 25 of the 139 loans, 18% of them, at a median of $7.6M — the small and mid-size multifamily and mixed-use buildings that were New York Community Bank's business for forty years. No other lender wrote more than seven. Multifamily is the most common property type (38 loans, $829.4M) and the smallest by dollars among the big three; mixed-use is 34 loans.
By lender type:
| Lender type | Loans | Volume | Share of volume |
|---|---|---|---|
| Bank | 82 | $5,746.8M | 66% |
| CMBS conduit | 19 | $1,477.8M | 17% |
| Life company | 11 | $609.2M | 7% |
| Debt fund | 11 | $447.4M | 5% |
| Other / unclassified | 12 | $378.0M | 4% |
| Agency | 4 | $45.2M | 1% |
| All stated | 139 | $8,704.4M |
The same 139 loans, by the type of institution that originated them. Types are assigned by rule and hand-checked for every lender printed on this page.
Citi appears twice because the record does: Citigroup Global Markets Realty and Citi Real Estate Funding are both conduit originators — Citi's 2017 pools split loans between them — and they are kept apart here as they are in the three-year lender ranking. Debt funds, prominent in that ranking, are 11 loans here: their paper is short and recent, and a 2024 bridge loan with a 2027 maturity rarely states it on a recorded instrument. The 12 loans under "other" are lenders our typing rule does not classify.
The biggest name on the list is the one leaving
Flagstar is New York Community Bank under a new name. NYCB bought Flagstar in 2022, took on Signature Bank's deposits and $12.9 billion of its loans — mostly commercial and industrial — from the FDIC in March 2023, nearly failed itself in early 2024 on the strength of its rent-regulated multifamily book, and adopted the Flagstar name that year. One of the city's most active multifamily lenders for two decades has spent the two years since reducing that book.
The numbers are the bank's own. Commercial real estate loans fell from $50.6 billion at the end of 2023 to $38.3 billion at the end of 2025. In the second quarter of 2026 alone, $1.1 billion of multifamily and CRE loans paid off at par, 39% of them from loans the bank had already classified substandard, and the New York City rent-regulated multifamily book shrank another $338 million, 4%, in the quarter. In January the chief executive, Joseph Otting, said new CRE originations — "a couple of billion in a year" — would come from Michigan, California and Florida to "offset some of that outflow" from New York City multifamily. By one count, Flagstar's rent-stabilized originations in New York went from $3.9 billion in 2019 to $58 million in 2025. In April it accepted a $4.8 million loss to let a fully performing Crown Heights loan refinance away early.
That is the lender with the most loans on the list — 8th by dollars, first by count. Its 25 stated-maturity loans are $252.9M of principal, 14 of them multifamily and 8 mixed-use, spread across Manhattan (10), Queens (7), the Bronx (4) and Brooklyn (4); 22 of the 25 were recorded in 2022, five-year paper from NYCB's last full year of volume before its 2024 crisis, and the heaviest month is May 2027, with 6 loans. And they are a floor: the record holds 1614 active Flagstar and NYCB loans of $5 million or more in New York, $23.10B, and only 197 of them state a maturity anywhere. Our model places 261 ($3.17B) in the next twelve months. A borrower on any of them is, in all likelihood, looking for a new lender — and Flagstar is also 2nd on the list of lenders whose loans passed their stated maturity in the last twelve months with nothing filed since (30 loans, $535.3M).
One caution, which applies to every row. The table names the originator, not the holder. Flagstar has sold loans — $142 million of rent-stabilized paper to Cantor Fitzgerald in January 2025, $247 million of notes on the Croman portfolio last November — and the sale of a loan is almost never recorded. Signature Bank is the larger case: its 1411 active NYC loans of $5 million or more on our record ($19.55B, 3 with a stated maturity in the window) went to FDIC joint ventures with Blackstone and others in late 2023, and every one still reads "Signature Bank" in ACRIS.
The refinancing these borrowers walk into
The loans in these tables were written mostly between 2016 and 2023, with 2017 the heaviest year (67 loans). Of the 105 that state a rate on the recorded instrument, the median is 3.88%, and three in four are at 4.37% or less. They come due into a market that moved against them twice in the last month.
On September 16 the Federal Open Market Committee raised the federal funds target to 3.75–4.00%, its first increase since July 2023, with sixteen of eighteen participants pencilling in one more before the year ends; the ten-year Treasury crossed 5% the same week, its highest since 2007. And on October 1 the Rent Guidelines Board's freeze took effect: 0% on one- and two-year renewals for the roughly one million stabilized apartments through September 2027. Fitch called the near-term risk limited and the risk of an extension real — frozen rents against operating costs rising about 5% a year "weaken property cash flow and increase refinancing and repayment risks."
The lending market those borrowers return to is less than half its former size. Mortgages on buildings at least half rent-stabilized fell from $27.6 billion across more than 3,700 deals in 2019 to under $11.3 billion across about 1,400 in 2025, by Atrium Data's count as reported by Bisnow; nonbank lenders' share of that fell too, from about $8.7 billion to $4.8 billion. The lenders that grew are few — Wells Fargo, from $610 million a year before 2023 to $1.3 billion a year since, and Webster. The institutions that wrote the wall are, with a few exceptions, not the ones refinancing it.
The layer underneath: matured, still open, by lender
These loans passed their stated maturity between Oct 2, 2025 and Oct 1, 2026 and show no satisfaction or discharge — the lien is still active on the record. There are 77 of them at $5 million or more, $2.55B.
| Originating lender | Type | Loans | Volume |
|---|---|---|---|
| Natixis Real Estate Capital | CMBS conduit | 2 | $790.0M |
| Flagstar Bank (formerly New York Community Bank) | Bank | 30 | $535.3M |
| Prudential Insurance Company of America | Life company | 4 | $347.0M |
| Citigroup Global Markets Realty | CMBS conduit | 6 | $162.6M |
| M&T Bank | Bank | 2 | $141.1M |
| Webster Bank (incl. Sterling National) | Bank | 2 | $96.1M |
| Dime Community Bank | Bank | 4 | $42.0M |
| Citi Real Estate Funding | CMBS conduit | 2 | $35.7M |
Active NYC commercial mortgages of $5M or more whose stated maturity passed in the last 12 months with no satisfaction recorded, by originating institution, largest first. Sterling National Bank's loans are counted with Webster, which absorbed it in 2022; one two-loan name the record does not resolve to an institution is left out.
Read it honestly: "open on the record" is the recorder's truth, not proof of default. Some were paid off or refinanced and the satisfaction never recorded. Each remains a live lien of record until a discharge is filed — and a lender's name on this list is a lender with workouts, extensions or recording lag, not a lender in trouble.
Loans you can check
Every figure above aggregates rows like these. Each traces to a recorded document by CRFN, and each parcel was checked for a later mortgage that would mark an unrecorded refinancing.
| Originating lender | Property | Borough | Type | Loan | Stated maturity | CRFN |
|---|---|---|---|---|---|---|
| Morgan Stanley Bank | 761 5 Avenue | Manhattan | Office | $2,300.0M | Jun 9, 2027 | 2017000213159 |
| Natixis Real Estate Capital | 85 Broad Street | Manhattan | Office | $358.6M | Jun 5, 2027 | 2017000205682 |
| Barclays Bank | 225 Park Avenue South | Manhattan | Office | $235.0M | Jun 6, 2027 | 2017000209245 |
| Wells Fargo Bank | 85 10 Avenue | Manhattan | Office | $396.0M | Dec 6, 2026 | 2016000433953 |
| Bank of Montreal | 107 West 97 Street | Manhattan | Multifamily | $365.0M | Aug 6, 2027 | 2022000341781 |
| Goldman Sachs Mortgage Company | 1 West 34 Street | Manhattan | Office | $150.0M | Apr 6, 2027 | 2017000118561 |
| Citigroup Global Markets Realty | 1460 Broadway | Manhattan | Commercial | $200.0M | Nov 6, 2026 | 2016000397622 |
| Flagstar Bank (formerly New York Community Bank) | 863 9 Avenue | Manhattan | Mixed-use | $35.8M | May 31, 2027 | 2023000192007 |
| Deutsche Bank AG New York Branch | 111 Livingston Street | Brooklyn | Office | $120.0M | Jan 6, 2027 | 2017000020814 |
One loan per lender for the largest originators, chosen by principal, each checked for a later mortgage on the same parcel. Addresses as recorded.
Methodology
- Source. NYC ACRIS (Manhattan, Brooklyn, Queens, Bronx), ingested in full and re-read weekly. Satisfactions, assignments, consolidations and modifications are matched back to the original loan by CRFN, so a satisfied or superseded loan never counts as active.
- Maturity dates. ACRIS records no maturity field. Dates here are read from the scanned instrument or taken from securitization disclosure (ABS‑EE); only stated dates are counted. Modelled dates are excluded from every table and quoted once, as context, in the first section.
- Unit of count. Loans, counted once each: a blanket loan recorded against several properties is one loan. Members of a single facility recorded as several instruments are counted once.
- Lender. The institution that originated the loan, as recorded. Spellings, legal names, successor names and lending vehicles are folded into one institution ("NEW YORK COMMUNITY BANK" and "FLAGSTAR BANK" are one row); desks that lend separately are kept separate. MERS, trustees, servicers and the FDIC's Signature venture — names that sit in the lender's seat without having lent — are left out. Lender types are assigned by rule and hand-checked for every name printed here.
- Floor and windows. Original principal ≥ $5,000,000, commercial property only (one-to-four family houses excluded). "Next 12 months" = stated maturity Oct 2, 2026 – Oct 1, 2027; "matured, still open" = stated maturity Oct 2, 2025 – Oct 1, 2026, active lien, no satisfaction or discharge recorded.
- Flagstar's corporate figures are from the bank's own quarterly releases and earnings calls, and the rent-stabilized market figures from Atrium Data as reported by Bisnow; each is linked under Sources.
- Verification. Any row can be pulled live through Circlemark or checked against the underlying record by CRFN. The extraction and verification pipeline is described in how we monitor NYC commercial mortgage maturities.
Frequently asked questions
- How much of NYC's 2026 maturity wall has a maturity date on paper?
- About one loan in 19. Of the 2664 active NYC commercial mortgages of $5 million or more that Circlemark's model places in the next twelve months, 139 ($8.70B) carry a maturity date read off the recorded instrument or a securitization disclosure. The rest are inferred from the origination date and a typical term. The lender table on this page counts only the part that is on paper.
- Which lender has the most NYC commercial loans coming due in the next 12 months?
- By count, Flagstar Bank, the former New York Community Bank: it originated 25 of the 139 loans of $5 million or more whose stated maturity falls between Oct 2, 2026 and Oct 1, 2027, $252.9M in all, mostly multifamily and mixed-use, across all four boroughs. By dollars the leaders are Morgan Stanley Bank — whose $2.3 billion GM Building loan is a quarter of the wall by itself — Natixis Real Estate Capital and Barclays Bank.
- Does the table show who holds each loan today?
- No. It names the lender that originated the loan, as recorded. Loans are sold, and the sale is rarely recorded: Flagstar has sold rent-stabilized loans to Cantor Fitzgerald and others, and Signature Bank's commercial real estate loans went to FDIC joint ventures with Blackstone and others after the bank failed in 2023. All of those still read under the original lender's name in ACRIS.
- Why does Flagstar matter for New York's maturity wall?
- Because the lender with the most loans coming due is the one most publicly reducing its New York exposure. Flagstar cut its commercial real estate book from $50.6 billion at the end of 2023 to $38.3 billion at the end of 2025, had $1.1 billion of multifamily and CRE loans pay off at par in the second quarter of 2026 alone, and has said new CRE originations will come from Michigan, California and Florida. Borrowers whose Flagstar loans mature this year are largely looking for a new lender.
Sources
- Federal Reserve: FOMC statement, September 16, 2026 — target range raised to 3-3/4 to 4 percent
- Commercial Observer: As Fed Hikes Rates for First Time Since 2023, Commercial Real Estate Comes to Terms (Sep 16, 2026)
- CRE Daily: NYC Rent Freeze Raises Red Flags for Multifamily Lenders (Sep 1, 2026)
- Flagstar Bank, N.A.: second quarter 2026 earnings release, Form 8-K (Jul 24, 2026)
- Flagstar Financial: Q4 2025 earnings call transcript (Jan 30, 2026) — new CRE originations in Michigan, California and Florida
- CRE Daily: Multifamily Loans Lift Flagstar Back to Profit (Feb 3, 2026)
- Bisnow: Flagstar Swallows $4.8M Loss To Shed Performing Rent-Stabilized Loan (Apr 27, 2026)
- Bisnow: Lenders' Rent-Stabilized Disappearing Act, By The Numbers (Mar 3, 2026; Atrium Data)
- The Real Deal: Flagstar, formerly NYCB, dumps $142M in rent-stabilized loans (Jan 27, 2025)
- Bisnow: Flagstar Sells $247M In Loans Tied To Steve Croman — The N.Y. Deal Sheet (Nov 4, 2025)
- FDIC: Flagstar Bank, N.A. assumes deposits and $12.9 billion of loans of Signature Bridge Bank (Mar 19, 2023)
- Blackstone: 20% equity stake in a venture holding approximately $17 billion of former Signature Bank commercial real estate loans (Dec 2023)
- NYC Open Data: ACRIS Real Property Master
- NYC Open Data: ACRIS Real Property References (cross-references by CRFN)
Read next
- NYC's 2026 maturity wall, borough by borough: $5.9B stated, $2.5B already past due
A per-borough data brief on New York City's 2026 commercial mortgage maturity wall — stated maturities only, read from the recorded instruments: 274 loans and $5.9B coming due in 12 months, 166 loans and $2.5B already matured and still open, 13 already carrying a distress filing. Every number traces to the record.
- Who lends on NYC commercial real estate: the 25 most active lenders (2026)
The lenders behind 14,656 NYC commercial mortgages recorded in the last three years, ranked by what they funded, by borough and property type.
- How we monitor NYC commercial mortgage maturities for brokers in 2026 (and why ACRIS makes it hard)
Where commercial mortgage maturity data actually comes from, why New York City's public records don't contain a maturity date, and how Circlemark turns recorded documents into a verified, weekly-refreshed list of loans coming due.