Who lends on NYC commercial real estate: the 25 most active lenders (2026)
The lenders behind 14,656 NYC commercial mortgages recorded in the last three years, ranked by what they funded, by borough and property type.
By Circlemark · · 10 min read · Figures as of Sep 29, 2026
Four in ten New York City commercial mortgages come from 25 lenders, and one of them — JPMorgan Chase — wrote about one in nine on its own. Counted from 14,656 mortgages recorded in Manhattan, Brooklyn, Queens and the Bronx over the last three years, each attributed to the institution that lent the money.
Every broker working a new market asks two questions in the same order: what is maturing, and who lends here. The second usually gets answered with a name a colleague remembers, or a vendor directory of every institution with a lending licence. That is not the same question.
So we counted it. Not who could lend on a New York building, but who did: one row per recorded mortgage, commercial property only, from the city's recorder.
The 25 most active commercial real estate lenders in NYC
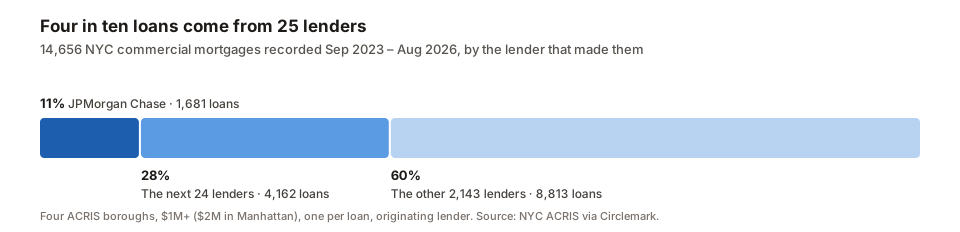 One lender made one loan in nine. The next 24 together made fewer than three in ten, and 2,143 others shared the rest.
| # | Lender | Type | Loans | Median | Middle half | Most active in | Last recorded |
|---|---|---|---|---|---|---|---|
| 1 | JPMorgan Chase Bank | Bank | 1,681 | $3.2m | $2.0–6.3m | Brooklyn | Aug 2026 |
| 2 | Cathay Bank | Bank | 316 | $2.0m | $1.5–3.4m | Brooklyn | Aug 2026 |
| 3 | Webster Bank | Bank | 282 | $6.4m | $2.6–17.0m | Brooklyn | Aug 2026 |
| 4 | National Cooperative Bank | Bank | 267 | $3.7m | $2.5–6.0m | Manhattan | Aug 2026 |
| 5 | TD Bank | Bank | 211 | $2.9m | $2.0–6.6m | Brooklyn | Aug 2026 |
| 6 | Flushing Bank | Bank | 207 | $2.8m | $1.7–4.5m | Queens | Jul 2026 |
| 7 | Citi Real Estate Funding | CMBS | 199 | $18.0m | $10.0–36.0m | Manhattan | Aug 2026 |
| 8 | Wells Fargo Bank | Bank | 198 | $23.1m | $10.0–108.3m | Manhattan | Aug 2026 |
| 9 | S3 Capital | Debt fund | 197 | $4.5m | $3.1–9.0m | Brooklyn | Aug 2026 |
| 10 | Valley National Bank | Bank | 196 | $11.9m | $3.2–30.1m | Brooklyn | Aug 2026 |
| 11 | Citizens Bank | Bank | 192 | $4.0m | $2.7–7.1m | Manhattan | Aug 2026 |
| 12 | Customers Bank | Bank | 187 | $4.0m | $2.5–8.8m | Brooklyn | Aug 2026 |
| 13 | Ponce Bank | Bank | 158 | $8.6m | $3.3–19.0m | Queens | Aug 2026 |
| 14 | M&T Bank | Bank | 154 | $5.5m | $2.6–13.9m | Manhattan | Aug 2026 |
| 15 | Bank of America | Bank | 154 | $7.5m | $3.2–27.3m | Manhattan | Aug 2026 |
| 16 | Ridgewood Savings Bank | Bank | 143 | $2.2m | $1.5–3.3m | Brooklyn | Aug 2026 |
| 17 | Popular Bank | Bank | 137 | $10.2m | $4.7–21.3m | Brooklyn | Aug 2026 |
| 18 | Flagstar Bank | Bank | 136 | $4.3m | $2.7–7.7m | Brooklyn | Jun 2026 |
| 19 | Broadview Capital | Debt fund | 135 | $2.4m | $1.6–4.5m | Brooklyn | Aug 2026 |
| 20 | Apple Bank | Bank | 126 | $5.0m | $3.0–12.4m | Manhattan | Jul 2026 |
| 21 | Peapack Private Bank & Trust | Bank | 120 | $3.5m | $2.1–5.6m | Brooklyn | Aug 2026 |
| 22 | Bank of Hope | Bank | 120 | $3.8m | $2.0–7.9m | Brooklyn | Aug 2026 |
| 23 | Derby Copeland Capital | Debt fund | 117 | $6.5m | $3.9–11.6m | Manhattan | Aug 2026 |
| 24 | Habib American Bank | Bank | 107 | $1.8m | $1.3–2.7m | Brooklyn | Jul 2026 |
| 25 | Northeast Community Bank | Bank | 103 | $4.3m | $3.0–10.3m | Bronx | Aug 2026 |
Commercial mortgages recorded against Manhattan, Brooklyn, Queens and Bronx parcels from September 28, 2023 to August 28, 2026, $1 million and up ($2 million in Manhattan), one row per mortgage, originating lenders only, one-to-four family houses excluded. "Middle half" is the 25th to 75th percentile of loan amounts. "Most active in" is the borough with the most of that lender's loans.
Volume vs. loan size: two different rankings
Chase leads by a wide margin on count, and its median loan is $3.2 million. That is the walk-up and small mixed-use business, done at volume. It is a different market from the one Wells Fargo is in at a $23.1 million median, or Citi Real Estate Funding at $18.0 million.
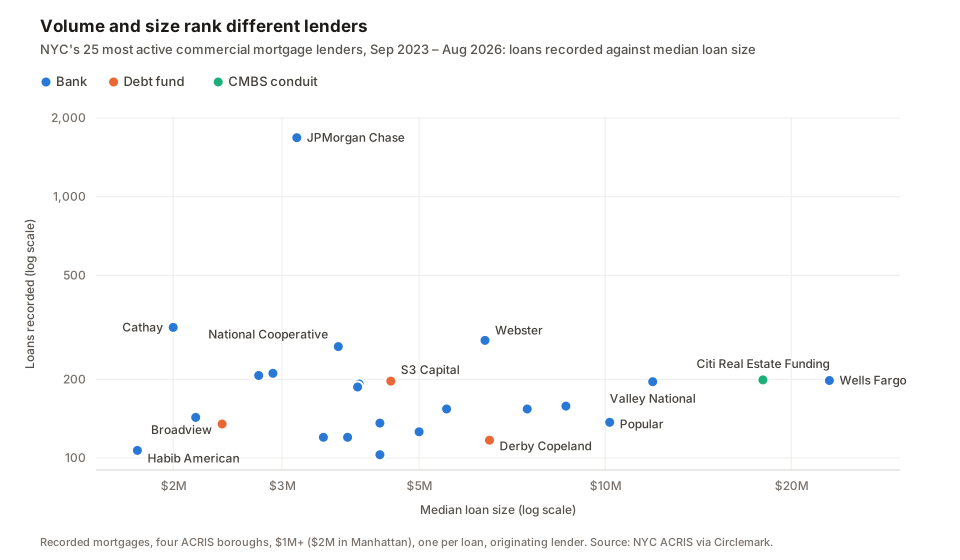 Each dot is one of the 25 lenders in the table. Up is more loans, right is a larger median loan; both scales are logarithmic. The private lenders sit among the banks, not in a corner of their own.
Read the table by size and it splits into businesses that barely compete:
- Under $3 million. Cathay, Flushing, Ridgewood, Habib American, TD and Broadview. Community and regional banks and a private lender doing small balance-sheet loans.
- $3–6 million. Chase, National Cooperative, Citizens, Customers, Flagstar, S3, Peapack, Bank of Hope, Northeast Community, Apple Bank, M&T. The mid-market, where banks and the bridge lenders overlap.
- Over $6 million. Webster, Valley National, Ponce, Popular, Bank of America, Derby Copeland, Citi Real Estate Funding and Wells Fargo. Larger balance-sheet, bridge and conduit execution.
A $3 million refinance and a $30 million one have few lenders in common. A list that does not say what size it is about is not much use.
Multifamily, mixed-use, office and industrial lenders in NYC
| Property type | Loans | Top five lenders by loans |
|---|---|---|
| Multifamily | 4,921 | Chase (932), National Cooperative (254), Flagstar (92), Webster (87), Citizens (79) |
| Mixed use | 3,564 | Chase (416), Cathay (138), Webster (69), Citizens (61), Ridgewood (60) |
| Office | 1,796 | Chase (138), Flushing (59), Customers (40), Peapack (39), TD (38) |
| Industrial | 691 | Cathay (36), Chase (29), Flushing (21), TD (16), Wells Fargo (16) |
National Cooperative Bank is second in multifamily on the strength of one market, co-op buildings, below. Mixed use — a store below apartments, the typical outer-borough building — is where the community banks show: Cathay and Ridgewood rank second and fifth there, and neither is in the multifamily top five.
Bridge and private lenders in NYC
Banks dominate the count, but a broker with a bridge, construction or transitional deal needs the non-bank list, and it is short. The nine most active private lenders:
| Lender | Loans | Median | Most active in |
|---|---|---|---|
| S3 Capital | 197 | $4.5m | Brooklyn |
| Broadview Capital | 135 | $2.4m | Brooklyn |
| Derby Copeland Capital | 117 | $6.5m | Manhattan |
| ICE Lender Holdings | 102 | $3.7m | Bronx |
| Maxim Credit Group | 55 | $17.0m | Manhattan |
| HirshMark Capital | 40 | $4.4m | Brooklyn |
| BridgeCity Capital | 39 | $10.5m | Brooklyn |
| Broad X Funding | 36 | $2.7m | Bronx |
| Levon Capital | 35 | $6.0m | Brooklyn |
Debt funds and private lenders, same loans and window as above, each firm's lending vehicles counted together. Emigrant Funding, a bank subsidiary typed as a private lender in the record, is left out.
Five of the nine are most active in Brooklyn, most with medians between $2 million and $6 million; Maxim and BridgeCity lend larger. Several record each deal in a new vehicle's name — Derby Copeland under more than 30 of them — which is why a count by name misses them and a count by firm does not.
Who lends on co-op buildings (underlying mortgages)
A co-op borrows as a corporation, against the whole building: the underlying mortgage. It is a market of its own, and a short one. Of the 476 commercial mortgages recorded on buildings the city classes as co-ops in the three years, National Cooperative Bank made 184, nearly four in ten, and Apple Bank 49. No other lender reached 20: Flushing (19), BNY Mellon (16), Northeast Community (15), TD (14) and Webster (12), plus the City's housing agency HPD (16), whose loans are subsidy programmes. A broker refinancing a co-op's underlying mortgage is working a list of a handful of names, and NCB is the one to beat.
Top lenders by borough: Manhattan, Brooklyn, Queens and the Bronx
The city-wide ranking hides lenders that are large in one borough and invisible in the rest:
- The Bronx. Northeast Community Bank recorded 87 of its 103 NYC loans there, ICE Lender Holdings 73 of 102, and Standard Insurance, a life company, 61 of 85.
- Queens. Amerasia Bank did 71 of its 94 loans in Queens, and Ponce and Flushing lean the same way.
- Brooklyn. S3 Capital did 149 of its 197, Broadview Capital 98 of 135, and Community Federal Savings Bank 78 of 94.
- Manhattan. Citi Real Estate Funding, Apple Bank, Citizens Bank and Derby Copeland each did more in Manhattan than in the other three boroughs combined.
The long tail is longer than the market
2,168 distinct institutions recorded a commercial mortgage in the four boroughs over the three years. 1,459 of them did exactly one, and only 492 reached three.
That tail is not a market to prospect. It is seller financing, family entities, a sponsor's own vehicle and one-off private lenders: real liens, but not names for a pitch rotation. It is also why lender counts run into six figures when every entity that ever appeared in a lender's position is counted. The number that matters for New York is about 500, and the working number is 25.
Counting institutions rather than names takes work, because lenders record under many. JPMorgan Chase appears under 64 spellings. Derby Copeland Capital, a Manhattan bridge lender, records its loans under more than 30 entity names, including a credit fund's vehicles and a joint venture with Fortress; counted name by name it is invisible, and counted as one lender it ranks 23rd. We fold spellings automatically and vehicles by review, against the sponsor's own filings; the methodology says how.
How this list is counted, and what it cannot tell you
It counts commercial loans, once each. One-to-four family houses and single condo and co-op units are left out — a lender list that keeps them is mostly home mortgages — and a loan over many parcels counts once, however many buildings it secures. Every spelling of a lender is one lender, and MERS, servicers and securitization trustees, which sit in the lender's seat without having lent, are left out.
Everything above is revealed behaviour, read backwards from instruments the City recorded. Four limits follow, and they matter more than the ranking.
It is not a credit box. No lender here has told us what it wants today. A recording is one past decision, not a policy. That is why every row is dated to its last recorded closing.
It is not a measure of fit. The table ranks by volume. It has no view on whether a lender would like your borrower, your basis or your business plan.
It names the originator, not the holder. Loans are sold. After Signature Bank failed in March 2023, its commercial real estate loans went to joint ventures the FDIC set up with Blackstone and others, and those mortgages are still recorded under Signature's name.
Recording lags closing. A loan appears when it is recorded, weeks to months after it closes, so the most recent months always look thinner than they will.
Who to call for a NYC multifamily or mixed-use refinance
A lender list is half an answer. The other half is a person, and the public record does not name one: the recorded mortgage is signed by the borrower, and the lender is a name and an address. (The borrower side is the opposite problem, and the record names more people there than you would expect.)
Some lenders fill the gap themselves. Eleven of these 25 publish their lending staff or leadership on their own site, which is where "who covers Brooklyn multifamily" becomes answerable. The other fourteen publish nothing, and no amount of data work turns a name into a person when the institution has chosen not to say.
Circlemark tracks both halves: every recorded loan in the market, and the people each lender publishes, with the page and date each name came from. See who lends on deals like yours.
Frequently asked questions
- Who is the biggest commercial real estate lender in New York City?
- By number of loans, JPMorgan Chase, by a distance: 1,681 of the 14,656 NYC commercial mortgages we can attribute to an originating lender over the last three years, about one in nine. Its median loan is $3.2 million, so the lead is small and mid-size buildings at volume. By size the picture changes: Wells Fargo's median NYC loan is $23.1 million and Citi Real Estate Funding's is $18.0 million.
- How concentrated is NYC commercial mortgage lending?
- Four in ten loans come from 25 lenders. The tail is long and thin: 2,168 distinct institutions recorded a commercial mortgage in the four ACRIS boroughs in the period, 1,459 of them exactly once, and only 492 reached three loans.
- Who is the biggest multifamily lender in New York City?
- JPMorgan Chase, which recorded 932 of the 4,921 NYC multifamily mortgages we can attribute over the last three years. National Cooperative Bank is second with 254, nearly three quarters of them on co-op buildings — a market that barely exists outside the city. Flagstar, Webster and Citizens follow.
- Who are the bridge and private lenders in NYC?
- By loans recorded in the last three years: S3 Capital (197, median $4.5 million), Broadview Capital (135, $2.4 million), Derby Copeland Capital (117, $6.5 million) and ICE Lender Holdings (102, $3.7 million), then Maxim, HirshMark, BridgeCity, Broad X and Levon. Five of the nine are most active in Brooklyn; Maxim and BridgeCity lend larger.
- Who lends on co-op buildings in NYC?
- National Cooperative Bank, by a distance: 184 of the 476 commercial mortgages recorded on New York co-op buildings in the last three years, nearly four in ten. Apple Bank is second with 49, and no other lender reached 20. These are underlying mortgages on the whole building, not share loans to apartment buyers.
- Does this tell me which lender will do my deal?
- No. It tells you who has done deals like it. Every number here is counted backwards from instruments the City recorded, so it is revealed behaviour, not a stated credit box. Appetite moves faster than recordings, which is why each lender is dated to its last recorded closing.
- Is the lender on the mortgage the one that holds it today?
- Not always. The table names the lender that originated each loan. Loans are sold and assigned: after Signature Bank failed in March 2023, its commercial real estate loans went to joint ventures the FDIC set up with Blackstone and others, and those mortgages are still recorded under Signature's name.
- Where does this data come from?
- ACRIS, the New York City Register's public record of every recorded instrument, joined to the city's property data. We count one row per mortgage, keep only the party that actually lent (dropping MERS, servicers and securitization trustees, which appear in the lender position constantly and never lent anyone anything), and fold the dozens of spellings each bank is recorded under — 64 for JPMorgan Chase — onto one institution.
Sources
- NYC Open Data: ACRIS Real Property Master (document type, amount, recorded date)
- NYC Open Data: ACRIS Real Property Parties (mortgagee and mortgagor names)
- NYC Open Data: ACRIS Real Property Legals (instrument to BBL)
- NYC Department of City Planning: PLUTO (building class and residential units)
- CoStar: Blackstone-led venture gets stake in failed Signature Bank's $16.8 billion commercial loan portfolio
- HousingWire: Flagstar acquires $38B in assets from Signature (commercial and industrial loans only)
Read next
- NYC investor house loans in 2026: 27,000 mortgages over $1M on 1–4 family homes, and when their rates reset
Brooklyn, Queens, the Bronx and Manhattan hold 27,286 active mortgages of $1 million or more on two- to four-family houses and single-family townhouses — $70.8 billion of investor debt that sits on no commercial loan list. We read the recorded Fixed/Adjustable Rate Riders. Here is who lent, when the fixed periods end, and how a broker works the list with the 10-year at 5%.
- NYC's 2026 maturity wall, borough by borough: $5.9B stated, $2.5B already past due
A per-borough data brief on New York City's 2026 commercial mortgage maturity wall — stated maturities only, read from the recorded instruments: 274 loans and $5.9B coming due in 12 months, 166 loans and $2.5B already matured and still open, 13 already carrying a distress filing. Every number traces to the record.
- How to find the owner of a commercial property in NYC (2026)
Find a NYC commercial property owner's name, title, email and phone from public records, even behind an LLC. Four city records, measured on 155,860 loans.