NYC ARM resets in 2027: what the riders say the rate becomes
ICE counts 186,020 adjustable-rate mortgages resetting nationally in 2027. In New York City the recorded Fixed/Adjustable Rate Riders say what those loans re-set to: the initial rate, the index, the margin and the caps on 5,563 active $1M+ loans with a stated first rate change — 384 of them in 2027 and 361 in 2028. The margins, the cap forms that decide the first year, and the 1,346 riders that still name one-year LIBOR.
By Andrew Zhong, founder of Circlemark · · 9 min read · Figures as of Oct 22, 2026
Key numbers. ICE counts 186,020 adjustable-rate mortgages reaching their first reset nationally in 2027, up from 148,000 this year, and says the 2020-vintage seven-year ARMs will take the largest step — a median $1,066 a month. That is the servicers' count. In one market the recorded riders themselves have been read: 5,563 active New York City loans of $1 million or more state a first rate change, $13.35B of original principal; 384 of them ($923M) change in 2027 and 361 ($835M) in 2028. Their riders say what the rate becomes: a median initial rate of 3.25% on the 2027 cohort, margins of 2.25 to 2.75 points over the index, caps of 5/1/5 on agency paper and 2/2/5 on bank paper — and, on 1,346 loans, an index that stopped publishing in June 2023.
The national story this month is volume: ARM demand at a four-year high, a reset peak in 2027, and ICE's Andy Walden saying it is not a systemic threat because post-2008 underwriting qualified every borrower at the fully indexed rate. All true, and all beside the point for a broker in Brooklyn. The broker's question is the one a Brooklyn investor put to us last week about a $3 million bank loan on a house in the borough: does it show the spread? The rider does. It prints the initial rate, the index, the margin and every cap on the page after the Change Date, and we read all of it on the Fixed/Adjustable Rate Riders recorded behind the city's $1 million-plus mortgages since 2015. This is what 5,563 of them say, as of October 23, 2026.
Counts are active, unmodified mortgages of $1 million or more ($2 million in Manhattan) whose recorded rider states a first Change Date. 5,488 are on one-to-four family houses — the investor house segment — and 75 are long-dated bank notes on commercial property where the lender recorded a rider. 5,242 (94%) state the initial rate, 4,753 (85%) the index and margin, 5,166 (93%) at least one cap; the rest state the date and nothing more. A further 1,467 loans ($3.41B) passed their first Change Date before today and are adjusting now.
What rate does a New York investor ARM reset to?
The index plus the margin, rounded to the nearest eighth, held inside the caps. The rider fixes two of those three things at closing, so the only unknown at the Change Date is the index print.
| Origination year | Loans with a stated rate | Median initial rate |
|---|---|---|
| 2019 | 426 | 3.42% |
| 2020 | 561 | 2.86% |
| 2021 | 688 | 2.56% |
| 2022 | 782 | 3.88% |
| 2023 | 479 | 5.88% |
| 2024 | 498 | 6.25% |
| 2025 | 639 | 5.75% |
Initial fixed rate as the rider restates it, active loans with a stated reset. The 2021 vintage is $1.73B of principal at a 2.56% median; 2022 is $1.95B at 3.88%.
| Index the rider names | Riders | Margin, 25th | Median | 75th |
|---|---|---|---|---|
| 30-day Average SOFR | 2,311 | 2.75 | 2.75 | 3 |
| One-year Treasury | 1,184 | 2.5 | 2.75 | 2.75 |
| One-year LIBOR | 1,195 | 2.25 | 2.25 | 2.25 |
Put the two tables together at one day's print and the arithmetic is the rider's, not ours. 30-day Average SOFR was 3.89% on October 22, 2026; a SOFR rider at the median 2.75 margin points to 6.64% before caps, against a 3.25% median initial rate on the loans changing in 2027 — a step of about 3.39 points. The one-year Treasury was 4.52% on October 21, 2026; a Treasury rider at 2.75 points to 7.27%. Those are illustrations at a dated print. The rate a borrower actually gets is set 45 days before the Change Date from whatever the index is then, and the property record shows the rider's terms, never a number we computed.
What the arithmetic says to a broker is simple. The typical 2019–2022 loan in this book was fixed somewhere between two and a half and four percent, and every index it can re-set on is near four. The reset is not a choice the borrower makes; it is a payment the note makes for them, and the only decisions left are whether to refinance into a fixed rate before the date, sell, or ride the caps.
Which index: SOFR, the Treasury, or a LIBOR that no longer publishes?
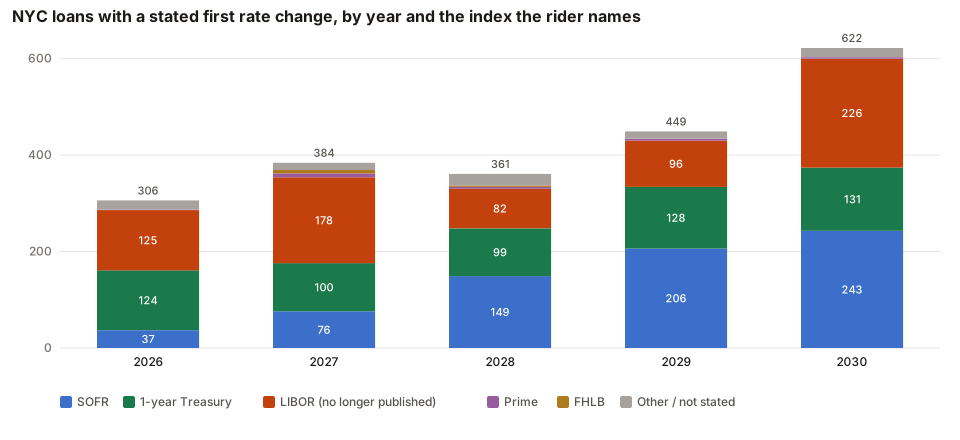 Active NYC $1M+ loans by stated first rate-change year and the index the recorded rider names, as of October 23, 2026. "Other" is a rider that states a date and no index.
| Reset year | Loans | Amount | LIBOR-named | One-year Treasury | SOFR | Median initial rate |
|---|---|---|---|---|---|---|
| 2026 | 306 | $705M | 125 | 124 | 37 | 3.63% |
| 2027 | 384 | $923M | 178 | 100 | 76 | 3.25% |
| 2028 | 361 | $835M | 82 | 99 | 149 | 3.8% |
The index tells you when the loan was written. Fannie Mae and Freddie Mac moved their uniform rider from one-year LIBOR to 30-day Average SOFR at the end of 2020, and the banks followed over 2021, so a rider naming SOFR is a 2021-or-later note and a rider naming LIBOR is a 2020-or-earlier one. The seven-year fixed periods written in 2019 and 2020 land in 2026 and 2027, which is why 46% of the riders changing in those two years name one-year LIBOR — 178 of the 2027 cohort, $485M of principal. From 2028 the balance tips: SOFR becomes the largest group, 44% of the 2028 riders and 47% of 2029's, and the LIBOR riders come back in 2030, when the ten-year fixed periods written in 2020 reach their Change Date.
One-year LIBOR stopped publishing on June 30, 2023, so a rider that names it is naming a number that no longer exists. The federal LIBOR Act settled what happens next, and the Federal Reserve's rule (12 CFR 253.4) spells it out: the note resets on a SOFR-based replacement plus a fixed tenor spread adjustment — 0.715 points for the 12-month tenor — which is 12-month CME Term SOFR for a consumer loan held outside the agencies and 30-day Average SOFR for a loan Fannie Mae or Freddie Mac holds. The adjustment is the historical gap between LIBOR and SOFR, frozen. So the 2.25-point margin on a 2019 LIBOR rider is not the bargain it looks beside the 2.75 on a 2022 SOFR rider: add the 0.715 and the LIBOR note re-sets at roughly 6.85% on the same October 22, 2026 print, about where the SOFR note does. The borrower who closed at 3% in 2020 (the LIBOR cohort's largest vintage, 423 loans) will see that arithmetic in a notice 60 to 120 days before the Change Date, from a servicer who may not be the lender on the recorded mortgage.
In all, 1,346 active loans, $3.23B, carry a rider naming LIBOR; 385 of them change between now and the end of 2028.
What are the caps, and which one bites in year one?
The caps are three numbers over the initial rate — the most the rate may rise at the first change, at each later change, and over the life of the loan — plus a floor. New York's riders come in two families, and the family matters more than the index for the first year's payment.
| Caps (first / each later / lifetime) | Riders | Share |
|---|---|---|
| 5/1/5 | 1,460 | 38% |
| 5/2/5 | 737 | 19% |
| 2/2/5 | 595 | 16% |
| 2/1/5 | 522 | 14% |
Riders stating all three caps, 3,824 loans. The rider prints each cap as an absolute rate ("will never be greater than 8.75%"); the table states them as points over the initial rate, the way the product is sold.
The 5/x/5 forms are the agency Fixed/Adjustable Rate Rider for seven- and ten-year fixed periods: the first change may take the whole five points, so a 3.25% note can go to 8.25% on day one if the index gets it there — and at a 6.64% fully indexed rate, it does not need to. The 2/x/5 forms are the bank portfolio riders for the most part: whatever the index, the first year is held to 5.25%, and the rest of the move arrives at the second and third Change Dates. Same index, same margin, a different first-year payment by two points. A broker reading a reset list should read the cap line before the index line.
The floor equals the margin on 81% of the 4,601 riders that state one: the rate can never fall below the margin alone, which at today's prints is a theoretical bound, not a working one.
Who holds them
1,051 loans, $2.46B, change between 2026 and 2028. Kings County holds 672 of them (64%, $1.20B); Manhattan holds 183 but $948M, the townhouse paper; Queens 181 ($282M); the Bronx 15. By lender, banks recorded 650 (62%) at a median 3.25% initial rate and 2.5 margin; 321 (31%) are MERS-registered or otherwise unclassified paper, at 4.06% and 2.75. The originators with the most 2027–2028 Change Dates on the record are First Republic Bank (now JPMorgan Chase) (93), Wells Fargo Bank (78), JPMorgan Chase Bank (67), Citizens Bank (34) and Cathay Bank (25). Who services each loan today is a different question — on a MERS mortgage, MERS ServicerID answers it from the 18-digit number on the instrument — and the house-loans brief covers the lender side of this segment in full.
How a broker works a reset list
Two sources in this month's coverage give the same window: reach the borrower four to six months before the Change Date, before the servicer's notice lands and before the borrower has already acted. The rider gives the broker the rest of the conversation. "Your note re-sets December 1 at one-year LIBOR plus 2.25, which is now term SOFR plus about 2.97, with a 2-point first-change cap" is a different opening from "rates are up." In Circlemark the reset is a stated event: filter by the next 6–12 months with "Stated dates only" on and 1–4 family houses included, and each row carries the Change Date, the fixed period, the cadence, the rate, the index, the margin and the caps, cited to the page of the recorded instrument. The Claude connector returns the same fields and is instructed never to compute a current rate from the index — the record states the terms, and the rate on any given day is for the borrower's notice to say.
The method is on the methodology page; every figure here is read from a recorded document, none is modelled, and the dated index prints are the Federal Reserve Bank of New York's and the Treasury's via FRED. If you hold one of these notes and the rider says something different from what your property record shows, write to us with the document number and we will re-read the page.
Frequently asked questions
- What rate does a 7/1 ARM reset to?
- The index the rider names plus the margin the rider states, rounded to the nearest eighth, subject to the caps. On New York's recorded riders the median margin is 2.75 points over 30-day Average SOFR, 2.75 over the one-year Treasury and 2.25 over one-year LIBOR. With 30-day Average SOFR at 3.89% on October 22, 2026, a SOFR rider at the median margin points to about 6.64% before caps — an illustration at one day's print, not a loan's rate. The first-change cap then decides whether the borrower gets there in year one.
- What is the margin on an adjustable-rate mortgage?
- A fixed number of percentage points the lender adds to the index at every Change Date, written into the note and restated on the recorded Fixed/Adjustable Rate Rider. It never changes for the life of the loan unless the index itself is replaced. The rider also prints the floor, which on 81% of New York riders equals the margin: the rate can fall no lower than the margin alone.
- What replaced LIBOR on an adjustable-rate mortgage?
- One-year LIBOR stopped publishing on June 30, 2023. Under the federal LIBOR Act and the Federal Reserve's rule (12 CFR 253.4) a mortgage that named it resets on a SOFR-based replacement plus a fixed tenor spread adjustment of 0.715 points for the 12-month tenor — 12-month CME Term SOFR for a consumer loan held outside the agencies, 30-day Average SOFR for a loan Fannie Mae or Freddie Mac holds. 1,346 active New York loans with a stated reset still name LIBOR on the recorded rider, 385 of them resetting in 2026–2028.
- What do 5/1/5 and 2/2/5 caps mean?
- Points over the initial rate: the most the rate can rise at the first change, at each later change, and over the life of the loan. The agency Fixed/Adjustable Rate Rider for 7- and 10-year fixed periods uses 5/1/5 or 5/2/5 — 62% of New York riders with every cap stated — so the first change can take the full move. Bank portfolio riders mostly use 2/2/5 or 2/1/5 (35%), which holds the first year to two points whatever the index does.
- Do commercial loans show a rate on the public record?
- Rarely. A commercial mortgage states its rate in the note, which is not recorded. A residential or small investor loan on the uniform instrument records the rider, which restates the initial rate, the index, the margin and the caps — so the 5,488 loans on one-to-four family houses in this count carry their economics on the public record, and the 75 long-dated bank notes do only where the lender recorded a rider.
- Where does the data come from?
- The NYC Department of Finance's ACRIS records and the scanned recorded instruments themselves — the Fixed/Adjustable Rate Rider behind the signature pages, read for the first Change Date, the fixed period, the adjustment cadence, the initial rate, the index, the margin and the caps. Every figure here is read from a recorded document and cited to its page on the property record; nothing is modelled. Index prints are the Federal Reserve Bank of New York's 30-day Average SOFR and the Treasury's one-year constant maturity, via FRED, on the dates given. National reset counts are ICE Mortgage Technology's, as reported October 6, 2026.
Sources
- HousingWire: ARM resets in 2027 pose limited risk, ICE says (October 6, 2026)
- ICE Mortgage Monitor: ARM demand hits nearly four-year high on rising mortgage rates (October 2026)
- 12 CFR 253.4 — Board-selected benchmark replacements (LIBOR Act): tenor spread adjustments
- Freddie Mac: LIBOR replacement index selections
- Fannie Mae Form 3142: Multistate Fixed/Adjustable Rate Rider — 30-day Average SOFR
- FRED: 30-Day Average SOFR (SOFR30DAYAVG), Federal Reserve Bank of New York
- FRED: 1-Year Treasury Constant Maturity (DGS1)
- NYC Open Data: ACRIS Real Property Legals (property_type per recorded document)
- Circlemark: NYC investor house loans in 2026 — 27,000 mortgages over $1M on 1–4 family homes, and when their rates reset (September 21, 2026)
Check one building
Type an address and see the mortgages recorded on it — lender, amount and the maturity read from the instrument. Free, no account.
Searches New York City. Only the house number and street matter — leave off the unit.
Read next
- ACRIS commercial mortgage search: a broker's guide to the NYC register (2026)
ACRIS indexes every mortgage recorded in Manhattan, the Bronx, Brooklyn and Queens, and it is free. It also indexes the wrong things for a broker: the document, not the loan; the amount, not the maturity; the satisfaction by a number nobody else uses. How to search it by building, by borrower and by lender, what to read in the result list, where the open-data mirror helps, and why no ACRIS search can produce a list of loans coming due.
- NYC rent-stabilized building loans: 3,269 reach their five-year mark this year, into a rate hike and a rent freeze — and who still lends on them
New York's recorded mortgages, joined for the first time to the rent-stabilized unit count on each building's Department of Finance tax bill and to the city's building class for co-ops. 24,875 active loans, $226B, sit on buildings with registered stabilized units; the largest cohort was written in 2021–22 at the bottom of the rate cycle, and 3,269 of those loans reach their five-year mark between now and October 2027 — into a Fed hike, a 5-year Treasury above 5% and a two-year rent freeze. Who lent in 2019 and who lends now, what happened to Investors Bank's co-op book, and how to read regulation off public records when no city roll records it.
- NYC's 2026 maturity wall, lender by lender: the bank with the most loans coming due is the one pulling back from New York
A data brief on the lenders behind New York City's 2026 maturity wall: 139 commercial mortgages of $5 million or more, $8.70B, whose maturity date is written into the recorded instrument and falls in the next twelve months, ranked by the institution that originated them and bucketed by lender type. One loan, the GM Building's, is a quarter of the dollars; by count the leader is Flagstar Bank, the former New York Community Bank — while it shrinks its New York book, the Fed raises rates and the city freezes stabilized rents.
More on New York City
- How the New York City record is read — what is different about the market's public record, what we cover there, and the live counts.
- Loans maturing by county: Manhattan · Bronx · Brooklyn · Queens — each county's maturity windows, collateral mix and the lenders behind the loans coming due, counted from the record.
- Every New York City post
Research from the county record
The rest of the briefs — one market, one lender or one cohort, counted from the recorded instruments and dated to the pull.
- Gas station, convenience store and car wash loans
- The debt behind Austin's renters' market
- Are banks back in commercial real estate lending?
- NYC rent-stabilized building loans coming due
- Why Texas files every warehouse as "commercial"
- NYC's 2026 maturity wall, lender by lender
- NYC investor house loans and the ARM wall
- DFW's 2026 maturity wall, county by county
- NYC's 2026 maturity wall, borough by borough
- A third of every NYC commercial loan list is an apartment