Austin is the best US city for renters. Here is the debt behind it: 802 apartment loans in Travis County, who wrote them, and when they come due
A data brief on the debt side of Austin's renters' market: the 1,194 multifamily deeds of trust of $1 million or more recorded in Travis County since 2015, the 366 written in the 2021–2023 supply wave, the institutions that wrote them by type and by name, what has happened to those loans since, and the 29 apartment loans that state a maturity in the next twelve months — counted from the county clerk's record and the instruments themselves, the week Apartment List ranked Austin the best city in America to rent in.
By Andrew Zhong, founder of Circlemark · · 17 min read · Figures as of Oct 22, 2026
Apartment List named Austin the best city in America to rent in on October 14: 9.0% of its apartments are vacant, rents are more than 20% below their 2022 peak, and more than half of its apartments are offered with over a month free. Every one of those discounts is paid out of a building's debt service. Travis County's record holds 802 active multifamily loans of $1 million or more, $24.83B in all. 366 were recorded in the three years that built the glut, and banks wrote more of it than anyone — 34% of the loans, spread across 67 of them. 29 apartment loans state a maturity date in the next twelve months, and they are mostly not the wave: the wave's maturities are, for the most part, not on paper yet.
The ranking is a renter's story, and it has been told well. What it leaves out is who is on the other side of every month of free rent: the lender whose deed of trust is recorded against the building. Texas does not disclose the price of a building, but it does record the loan — the deed of trust states the lender, the borrower, the original principal and, on a little under half of instruments, the maturity date. So we counted the debt behind Austin's renters' market the way we counted New York's maturity wall and ranked Texas's lenders: one row per recorded deed of trust, $1 million and up, from the Travis County Clerk's record since 2015, the property typed by the appraisal district.
Counts are as of October 20, 2026. "Multifamily" means a parcel the Travis Central Appraisal District classifies as apartments — the district's own code, not our guess. "Lender" means the institution that lent the money, with its recorded spellings folded together; trustees, servicers and MERS are left out.
The renters' market, in the landlord's numbers
Apartment List's ranking scored 71 cities on sixteen measures in five groups — housing affordability, housing leverage, cost of living, economic opportunity and lifestyle — and Austin scored 69.4, ahead of Salt Lake City at 68.6 and Charleston at 62.6. It won on leverage: a 9.0% vacancy rate against 6.8% nationally, rents down 2.3% in the year and more than 20% from the 2022 peak, and "over half of all apartments offering more than a month of free rent," in the report's words. It also ranked first for economic opportunity, on 7% job growth and 3.3% unemployment.
Brokers' numbers are harsher, because they count the professionally managed stock where the new supply landed. Matthews put metro vacancy at 12.29% in the second quarter of 2026, down 289 basis points from a 15.78% peak in the third quarter of 2024, with completions down 56.4% year over year and a construction pipeline equal to 4.55% of inventory against 19.67% at the start of 2023. The wave has broken. What it left behind is leased-up buildings at concession-adjusted rents, and loans that were sized to the rents of 2021 and 2022.
Who financed the wave
Multifamily deeds of trust recorded in Travis County peaked in 2021: 167 loans of $1 million or more, $5.04B. Across 2021, 2022 and 2023 together, 366 multifamily loans, $9.95B — 31% of every multifamily loan the county has recorded since 2015, at a median of $16.1M. The count fell to 43 in 2024 and 60 in 2025, and has come back to 128 so far this year — $5.62B, more multifamily dollars than in any full year in the table. The record does not label a deed of trust a refinancing, but the wave's rollover is in that figure.
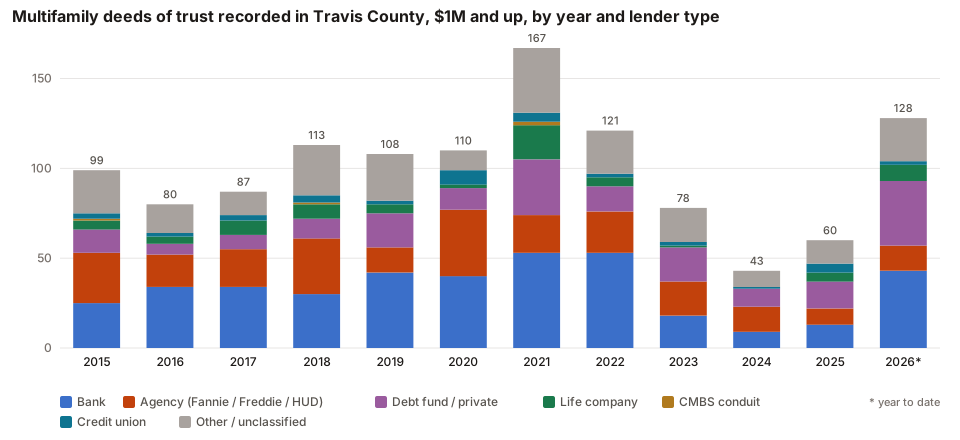
| Year | All commercial | Volume | Multifamily | Volume | Untyped | Still active | MF still active |
|---|---|---|---|---|---|---|---|
| 2015 | 965 | $16.46B | 99 | $1.65B | 540 | 789 | 66 |
| 2016 | 927 | $19.03B | 80 | $2.16B | 518 | 745 | 48 |
| 2017 | 972 | $20.03B | 87 | $1.79B | 554 | 787 | 61 |
| 2018 | 1,008 | $22.03B | 113 | $4.28B | 502 | 796 | 76 |
| 2019 | 954 | $24.32B | 108 | $2.65B | 497 | 781 | 77 |
| 2020 | 873 | $13.89B | 110 | $2.53B | 441 | 702 | 68 |
| 2021 | 1,213 | $23.45B | 167 | $5.04B | 514 | 942 | 97 |
| 2022 | 1,184 | $24.06B | 121 | $3.22B | 526 | 937 | 69 |
| 2023 | 619 | $11.05B | 78 | $1.69B | 297 | 500 | 58 |
| 2024 | 563 | $10.84B | 43 | $1.10B | 236 | 440 | 29 |
| 2025 | 694 | $18.73B | 60 | $1.99B | 235 | 578 | 45 |
| 2026 | 859 | $25.16B | 128 | $5.62B | 270 | 741 | 108 |
Deeds of trust of $1M or more recorded against Travis County parcels, originating lenders only, one row per loan, by year recorded. "Multifamily" is the appraisal district's classification. "Untyped" is a loan whose property the record has not yet tied to an appraisal parcel; it has no type and is counted in the first column only. "Still active" means no release, foreclosure or superseding instrument is matched on the record — see the caveats below.
It was big money. 156 of the 366 loans were $25 million or more, and they are 84% of the dollars; 149 were under $10 million. And it was, by count, bank money:
| Lender type | Loans | Volume | Share of loans | Lenders | Open on the record |
|---|---|---|---|---|---|
| Bank | 124 | $3.39B | 34% | 67 | 52 |
| Other / unclassified | 79 | $2.00B | 22% | 50 | 30 |
| Debt fund / private | 64 | $1.51B | 17% | 37 | 33 |
| Agency (Fannie / Freddie / HUD) | 63 | $1.74B | 17% | 15 | 32 |
| Life company | 25 | $1.19B | 7% | 16 | 15 |
| Credit union | 9 | $50.3M | 2% | 4 | 3 |
| CMBS conduit | 2 | $60.5M | 1% | 1 | 0 |
| All | 366 | $9.95B | 190 | 165 |
The 366 multifamily loans of $1M or more recorded in 2021–2023, by the type of institution that originated them. "Open on the record" is explained in the next section.
Banks wrote 34% of the loans ($3.39B), agency lenders — Fannie Mae and Freddie Mac seller-servicers and HUD — 17%, debt funds and private lenders 17%, life companies 7%; 22% are institutions our typing rule does not classify. That is not the Texas pattern. In the six-county ranking multifamily belonged to the agencies, and the first bank came fifth. Austin's wave was financed on bank balance sheets — and on many of them: the 124 bank loans came from 67 banks, the 63 agency loans from 15 seller-servicers.
That spread is why the names at the top of the table are agencies anyway:
| # | Originating lender | Type | Loans | Volume | Median loan | Last Travis closing |
|---|---|---|---|---|---|---|
| 1 | CBRE Capital Markets | Agency (Fannie / Freddie / HUD) | 11 | $219.8M | $22.2M | Jan 11, 2023 |
| 2 | Wells Fargo Bank | Bank | 10 | $290.7M | $29.7M | Dec 14, 2023 |
| 3 | Austin Housing Finance Corporation | Public / subsidy | 10 | $130.8M | $6.5M | Dec 14, 2023 |
| 4 | Berkadia Commercial Mortgage | Agency (Fannie / Freddie / HUD) | 9 | $275.5M | $28.0M | Dec 14, 2023 |
| 5 | Walker & Dunlop | Agency (Fannie / Freddie / HUD) | 8 | $164.5M | $15.2M | Jun 28, 2023 |
| 6 | ReadyCap Commercial (Ready Capital) | Debt fund / private | 7 | $54.2M | $8.7M | Sep 1, 2023 |
| 7 | JLL Real Estate Capital | Agency (Fannie / Freddie / HUD) | 6 | $107.1M | $16.4M | Mar 27, 2023 |
| 8 | Bellwether Enterprise Real Estate Capital | Agency (Fannie / Freddie / HUD) | 5 | $132.1M | $21.0M | Jul 24, 2023 |
| 9 | ORIX Real Estate Capital (now Lument) | Agency (Fannie / Freddie / HUD) | 5 | $51.3M | $8.2M | Nov 16, 2022 |
| 10 | VeraBank | Bank | 5 | $28.6M | $5.0M | Dec 13, 2022 |
| 11 | CBRE Multifamily Capital | Agency (Fannie / Freddie / HUD) | 4 | $390.2M | $61.7M | May 2, 2022 |
| 12 | Capital One | Bank | 4 | $297.1M | $6.7M | Dec 16, 2022 |
| 13 | Bank of America | Bank | 4 | $222.2M | $47.2M | Aug 11, 2021 |
| 14 | LoanCore Capital Credit REIT | Debt fund / private | 4 | $212.6M | $55.1M | Dec 6, 2021 |
| 15 | MetLife Real Estate Lending | Life company | 4 | $207.0M | $52.5M | Feb 24, 2022 |
Originating lenders of the 366 multifamily loans of $1M or more recorded in Travis County in 2021–2023, by count. Median loan is the median original principal. Lender types are the record's, hand-checked for every name printed.
CBRE Capital Markets wrote the most, 11 — CBRE's two agency desks together wrote 15 — then Wells Fargo Bank (10 loans, $290.7M) and Austin Housing Finance Corporation (10 loans, $130.8M). No bank wrote more than 10. By dollars the order is a bank's: JPMorgan Chase Bank (3 loans, $405.4M), then CBRE Multifamily Capital (4 loans, $390.2M) and Capital One (4 loans, $297.1M). In the last 36 months — the window our Travis County lenders page uses — the most active multifamily lenders have been Builder Circle Finance (15 loans, $32.4M), Berkadia Commercial Mortgage (14 loans, $408.1M) and CBRE Multifamily Capital (5 loans, $458.9M), out of 243 loans.
What happened to the wave
Three to five years on, most of the wave's loans have been dealt with, and the record shows it two ways. A release, where the clerk's index lets us match one. And a later deed of trust on the same parcel, which means the building was refinanced or sold whether or not a release was matched — in a county where releases match poorly (below), that is the better signal.
| Recorded | Loans | Release matched | Later deed of trust on the parcel | Open on the record | Of which state a maturity | Stated maturity in next 12 months |
|---|---|---|---|---|---|---|
| 2021 | 167 | 70 | 31 | 66 | 37 | 3 |
| 2022 | 121 | 52 | 15 | 54 | 29 | 1 |
| 2023 | 78 | 20 | 13 | 45 | 18 | 1 |
| All | 366 | 142 | 59 | 165 | 84 | 5 |
The 366 multifamily loans recorded in 2021–2023: a release matched on the record; still shown active but with a later deed of trust recorded against the same parcel; and open on the record with nothing recorded since. The last two columns count only the open loans.
201 of the 366 (55%) are released or succeeded by a later lien. 165 are open on the record with nothing recorded since — $4.64B of original principal. 2 of them carry a recorded modification or extension. And only 84 of the 165 (51%) state a maturity date on the instrument; the other 81 were written on paper that leaves the date to the note, which is not recorded. When the open loans come due, as far as the record says:
| Year due | Stated on the instrument | Volume | Stated or modelled | Volume |
|---|---|---|---|---|
| 2022 | 1 | $300.0M | 1 | $300.0M |
| 2023 | 4 | $219.4M | 11 | $553.1M |
| 2024 | 8 | $73.8M | 17 | $419.5M |
| 2025 | 2 | $77.3M | 16 | $449.2M |
| 2026 | 12 | $307.1M | 27 | $841.5M |
| 2027 | 3 | $108.0M | 17 | $318.5M |
| 2028 | 5 | $73.7M | 11 | $136.4M |
| 2029 | 5 | $74.4M | 5 | $74.4M |
| 2030 | 2 | $110.2M | 2 | $110.2M |
| 2031 | 7 | $164.2M | 15 | $487.0M |
| 2032 | 5 | $83.0M | 8 | $190.4M |
| 2033 | 6 | $120.4M | 11 | $292.4M |
| 2035 | 2 | $34.1M | 2 | $34.1M |
| 2036 | 1 | $35.8M | 1 | $35.8M |
| 2039 | 2 | $35.0M | 2 | $35.0M |
| 2040 | 1 | $38.6M | 1 | $38.6M |
| 2041 | 1 | $1.7M | 1 | $1.7M |
| 2042 | 1 | $1.8M | 1 | $1.8M |
| 2046 | 1 | $1.6M | 1 | $1.6M |
| 2047 | 2 | $2.3M | 2 | $2.3M |
| 2048 | 1 | $3.5M | 1 | $3.5M |
| 2052 | 2 | $37.9M | 2 | $37.9M |
| 2054 | 1 | $50.0M | 1 | $50.0M |
| 2056 | 2 | $38.9M | 2 | $38.9M |
| 2057 | 1 | $4.2M | 1 | $4.2M |
| 2058 | 1 | $33.7M | 1 | $33.7M |
| 2059 | 1 | $13.8M | 1 | $13.8M |
| 2061 | 4 | $134.6M | 4 | $134.6M |
Open 2021–2023 multifamily loans by maturity year: stated on the recorded instrument, and stated or estimated by our model from the origination date and a typical term for the lender type and loan size (shown ≈ in the product). Only stated dates are used elsewhere in this brief.
On paper, 2026 is the heaviest year, with 12 stated maturities ($307.1M), and it stays the heaviest with the model's estimates added (27 loans, $841.5M). The rows for past years are open loans whose stated date has passed with nothing recorded since — on this county's record, as likely an unmatched release or an extension by letter as anything else, and not read here as anything more. 5 of the open wave loans state a maturity in the next twelve months.
What states a maturity in the next twelve months
Of the 802 active multifamily loans in the county, 360 (45%) carry a maturity date written on the recorded instrument. 29 of those dates fall between Oct 20, 2026 and Oct 19, 2027: $670.7M of original principal, median $22.1M. Another 23 ($353.7M) state a maturity in the following twelve months, and the active book's stated maturities run 17 loans in 2027 and 20 in 2028.
| Originating lender | Type | Loans | Volume |
|---|---|---|---|
| Walker & Dunlop | Agency (Fannie / Freddie / HUD) | 3 | $108.5M |
| Northwestern Mutual Life Insurance | Life company | 3 | $34.8M |
| D&L Rent Properties | Other / unclassified | 2 | $4.3M |
| Ares CRE Lender (Ares Commercial Real Estate) | Debt fund / private | 1 | $95.0M |
| 3801 Ben Garza Lane Apartments Capital | Other / unclassified | 1 | $73.1M |
| BREDIF MS Seller | Other / unclassified | 1 | $51.9M |
| Prudential Insurance Company of America | Life company | 1 | $49.5M |
| MetLife Real Estate Lending | Life company | 1 | $37.8M |
| TexasBank | Bank | 1 | $33.3M |
| Allstate Life Insurance | Life company | 1 | $30.8M |
Active multifamily loans of $1M or more in Travis County with a stated maturity between Oct 20, 2026 and Oct 19, 2027, by originating institution.
These are not the wave. 9 of the 29 were recorded in 2017 — ten-year paper from the last cycle — and only 6 in 2021–2023. Life companies wrote 9 of them ($191.4M), agencies 5, banks 5; 8 are lenders our rule does not type. The heaviest month is February 2027, with 5 loans ($115.9M). Multifamily is 9% of the 307 commercial loans of any type that state a maturity in the window in Travis County ($3.33B).
The wave's refinancing is in the record a different way: in the 201 loans already released or succeeded, and in the 81 open ones whose maturity is on a note the county never sees. Counting our model's estimates, 58 multifamily loans come due in the window — a figure to search with, not to publish.
Two things the record does not say about any of these loans. It does not say who holds them: an agency loan is securitized at closing, a bank loan may have been sold, and a sale is rarely recorded, so each row names the originator. And it does not say whether they are current. A stated maturity in the window is a refinancing event in a market where Trepp's multifamily CMBS delinquency rate was 7.69% in August 2026 — not a finding about any one of them.
What the record cannot say in Travis County yet
Every figure above is a floor, and three limits make it a lower one than in Dallas or New York.
- 5,129 active commercial loans (59%) have no property type, because the record has not yet tied their property to an appraisal parcel — Travis's clerk indexes a legal description and no address, and the appraisal district's deed numbers place about 60% of them. Some of those loans are apartments. They are counted as untyped, never guessed.
- Releases match less often here. The clerk's index names one party a side and carries no marginal reference to the instrument being released, so a release is matched by borrower and parcel alone. About 13% of the county's loans since 2015 show a matched release, against 22–25% in Bexar County. That is why this brief reads a later deed of trust on the parcel as the second signal, and why it prints no "matured, no payoff recorded" figure for Travis County — on this record an unmatched release and an open loan look the same.
- Foreclosures are not matched. Travis records a foreclosure conveyance as a plain deed; the notice of substitute trustee sale is the open signal and is being matched. No loan on this page is described as in default, and none should be read that way.
Loans you can check
Every figure above aggregates rows like these. Each traces to a Travis County instrument number, and each parcel was checked for a later deed of trust that would mark an unrecorded refinancing (9 of the 29 had one and are left out here).
| Originating lender | Property | Loan | Stated maturity | Recorded | Instrument |
|---|---|---|---|---|---|
| 3801 Ben Garza Lane Apartments Capital | 4009 Sabio Dr | $73.1M | Feb 28, 2027 | May 1, 2017 | 2017068590 |
| BREDIF MS Seller | 5629 N Lamar Blvd | $51.9M | Jun 10, 2027 | Jun 4, 2025 | 2025062247 |
| Prudential Insurance Company of America | 2511 W Braker Ln | $49.5M | Nov 5, 2026 | Oct 15, 2021 | 2021230026 |
| Walker & Dunlop | 615 W 7 St | $45.3M | Oct 1, 2027 | Sep 25, 2017 | 2017153614 |
| Walker & Dunlop | 4800 Steiner Ranch Blvd | $38.8M | Dec 1, 2026 | Nov 18, 2016 | 2016192612 |
| MetLife Real Estate Lending | 13301 Center Lake Dr | $37.8M | Dec 1, 2026 | Nov 30, 2021 | 2021262782 |
| TexasBank | 5321 Barton Creek Blvd | $33.3M | Oct 2, 2027 | Sep 30, 2025 | 2025109176 |
| Allstate Life Insurance | 17900 Pfluger Farm Ln | $30.8M | Apr 1, 2027 | Mar 25, 2020 | 2020049409 |
| Jackson National Life Insurance | 9901 N Ranch Rd 620 | $30.0M | Jun 1, 2027 | May 28, 2025 | 2025058852 |
| Walker & Dunlop | 7495 Chevy Chase Dr | $24.4M | Sep 1, 2027 | Aug 12, 2020 | 2020143447 |
The largest active multifamily loans of $1M or more with a stated maturity between Oct 20, 2026 and Oct 19, 2027 and no later deed of trust on the same parcel. Addresses as the appraisal district records them. Property type is the district's.
Methodology
- Source. The Travis County Clerk's official public records (deeds of trust, releases, partial releases, modifications, extensions, assignments, lis pendens), read in full from 2015 and weekly since; the recorded instrument for the amount and the maturity date, read page by page; the Travis Central Appraisal District roll for the parcel, its owner and its state-use classification.
- Unit of count. Loans, counted once each: a deed of trust recorded against several parcels is one loan. A facility perfected by several deeds of trust each stating the full note is counted once, on the widest recording; 1,528 loans in the count are such recordings, and the member recordings they supersede are not counted. Deeds securing corporate credit facilities are excluded.
- Floor and window. Original principal of $1,000,000 or more, read off the instrument; one-to-four family houses excluded. "Recorded in 2021–2023" is by the instrument's recording date. "Next 12 months" is a stated maturity between Oct 20, 2026 and Oct 19, 2027 on a loan with no matched release; modelled maturities are quoted as context and used in no ranking.
- Lender. The institution that originated the loan, as recorded, with spellings and lending vehicles folded into one name; MERS, trustees and servicers are left out. Lender types are assigned by rule and hand-checked for every name printed here. Successor names are footnoted, never merged.
- Property type. The appraisal district's state-use code on the resolved parcel. A loan on a property not yet tied to a parcel has no type and appears only in the all-commercial columns.
- Later deed of trust. A deed of trust of $1M or more recorded against the loan's largest parcel after the loan's own recording date. It marks a refinancing or a sale; it does not say which.
- Verification. Any row can be pulled live through Circlemark or checked against the clerk's record by instrument number. The county's full counters are on the Travis County maturities page, recomputed daily.
Frequently asked questions
- How many multifamily loans are there in Travis County?
- 802 active deeds of trust of $1 million or more on parcels the Travis Central Appraisal District classifies as multifamily, $24.83B of original principal, as of October 20, 2026; the median loan is $13.6M. A further 5,129 active commercial loans (59% of the county's) sit on properties the record has not yet tied to an appraisal parcel and carry no type, so the multifamily count is a floor.
- Who financed Austin's apartment supply wave?
- Banks ahead of anyone, and many of them. Of the 366 multifamily deeds of trust of $1 million or more recorded in Travis County in 2021, 2022 and 2023, banks wrote 34% (124 loans across 67 banks), agency lenders — Fannie Mae and Freddie Mac seller-servicers and HUD — 17%, debt funds and private lenders 17%, life companies 7%. By count the most active single name was CBRE Capital Markets with 11; by dollars JPMorgan Chase Bank. 190 institutions wrote at least one.
- How many Austin multifamily loans mature in the next 12 months?
- 29 loans of $1 million or more, $670.7M, carry a maturity date written on the recorded deed of trust that falls between Oct 20, 2026 and Oct 19, 2027. Only 6 of them were recorded in 2021–2023; 9 were recorded in 2017, ten-year paper, and life companies wrote 9. Counting our model's estimates as well, 58 come due in the window; only the stated figure is used in this brief.
- What happened to the loans that financed the wave?
- Of the 366 multifamily loans recorded in 2021–2023, 142 have a release matched on the record and another 59 have a later deed of trust recorded against the same parcel — refinanced or sold, the release unmatched. 165 (45%, $4.64B) are open on the record with nothing recorded since; 84 of those state a maturity date on the instrument, and the rest are inferred from the origination date and a typical term.
- Why was Austin named the best city for renters in 2026?
- Apartment List's Best Cities for Renters 2026, published October 14, scored 71 cities on 16 measures across housing affordability, housing leverage, cost of living, economic opportunity and lifestyle. Austin scored 69.4 to Salt Lake City's 68.6 and Charleston's 62.6, on a 9.0% vacancy rate against 6.8% nationally, rents down more than 20% from the 2022 peak and 2.3% in the past year, more than half of apartments offering over a month of free rent, and 7% job growth.
- Where does the data come from?
- The Travis County Clerk's official public records (deeds of trust, releases, modifications and assignments, read in full since 2015 and weekly since), the instruments themselves for the amount and the maturity date, and the Travis Central Appraisal District roll for the property and its type. One row per loan, $1 million and up, the institution that lent the money only. Every figure traces to an instrument number.
Sources
- Apartment List: Best Cities for Renters 2026 (Oct 14, 2026)
- Apartment List: Which U.S. Metro Areas Are Renter's Markets? (Aug 2026 data)
- Matthews: Austin Multifamily Vacancy Drops 289 Basis Points as Supply Wave Breaks (Q2 2026)
- Yield Pro: Multifamily CMBS delinquency rate holds steady in August (Trepp, Sep 2026)
- Yahoo Finance: Austin apartment glut drives surge in rent concessions
- Circlemark: Who lends on Texas commercial real estate (Oct 14, 2026)
- Travis County Clerk — official public records search
- Travis Central Appraisal District
Check one building
Type an address and see the mortgages recorded on it — lender, amount and the maturity read from the instrument. Free, no account.
Searches Austin. Only the house number and street matter — leave off the unit.
Read next
- Who lends on Texas commercial real estate: the 25 most active lenders in Dallas–Fort Worth, San Antonio and Austin (2026)
The lenders behind 15,985 commercial mortgages recorded in Dallas–Fort Worth, San Antonio and Austin over the last three years, ranked by what they funded, by county, property type and loan size — and why no lender owns Texas the way one owns New York.
- Gas station, convenience store and car wash loans in New York and Dallas–Fort Worth: 864 on the record, who lends on them, and when they come due
A data brief on the debt behind fuel retail in two markets: the 864 active mortgages of $1 million or more recorded against gas stations, convenience stores and car washes in New York City and Dallas–Fort Worth, how each county's own records identify the use (DOF building classes G3–G5 and GW, the Dallas and Collin appraisal rolls, the businesses on file in Tarrant and Denton), which lenders wrote them, and what the instruments say about when they come due.
- How to use the Circlemark search: every filter, column and mark, from the maturity window to the Monday email
A walkthrough of the signed-in search page for New York City and Texas: how the maturity window reads a stated date against an estimate, what each property-type, lender and borrower control matches, the New York-only co-op and rent-regulation filters, how to read a row's badges and the score, the map, and what Save search, Export CSV and the watchlist do on each plan — with the guide behind each control linked where the record itself is the question.
More on Austin
- How the Austin record is read — what is different about the market's public record, what we cover there, and the live counts.
- Loans maturing by county: Travis County — each county's maturity windows, collateral mix and the lenders behind the loans coming due, counted from the record.
- Every Austin post
Research from the county record
The rest of the briefs — one market, one lender or one cohort, counted from the recorded instruments and dated to the pull.
- Gas station, convenience store and car wash loans
- NYC ARM resets in 2027: what the riders say
- Are banks back in commercial real estate lending?
- NYC rent-stabilized building loans coming due
- Why Texas files every warehouse as "commercial"
- NYC's 2026 maturity wall, lender by lender
- NYC investor house loans and the ARM wall
- DFW's 2026 maturity wall, county by county
- NYC's 2026 maturity wall, borough by borough
- A third of every NYC commercial loan list is an apartment